When you open a busy repository on GitHub, the pulse page and the commit list tell you that work is happening, but they rarely show the shape of that work. Was last week a burst of small fixes or one giant feature merge? Did deletions finally catch up with months of additions? A git commit history visualizer answers those questions in one glance.
What a commit chart is actually for
I use commit charts for three practical jobs:
- Onboarding onto an unfamiliar public repo — see whether the default branch is still active and how dense the recent history is.
- Writing a README that shows real activity instead of a static badge.
- Scanning GitHub Trending archives when I want historical context, not only today's list.
A free visualizer that stays in the browser
GitStock is a free web tool aimed at exactly that workflow. You enter a public GitHub repo as owner/repo. It pulls the latest 100 commits on the default branch and draws an interactive candle-style activity chart: commit hash, message, additions and deletions. You can replay the timeline and share the result as an SVG URL, a still image, a Markdown or HTML README embed, or an MP4 video.
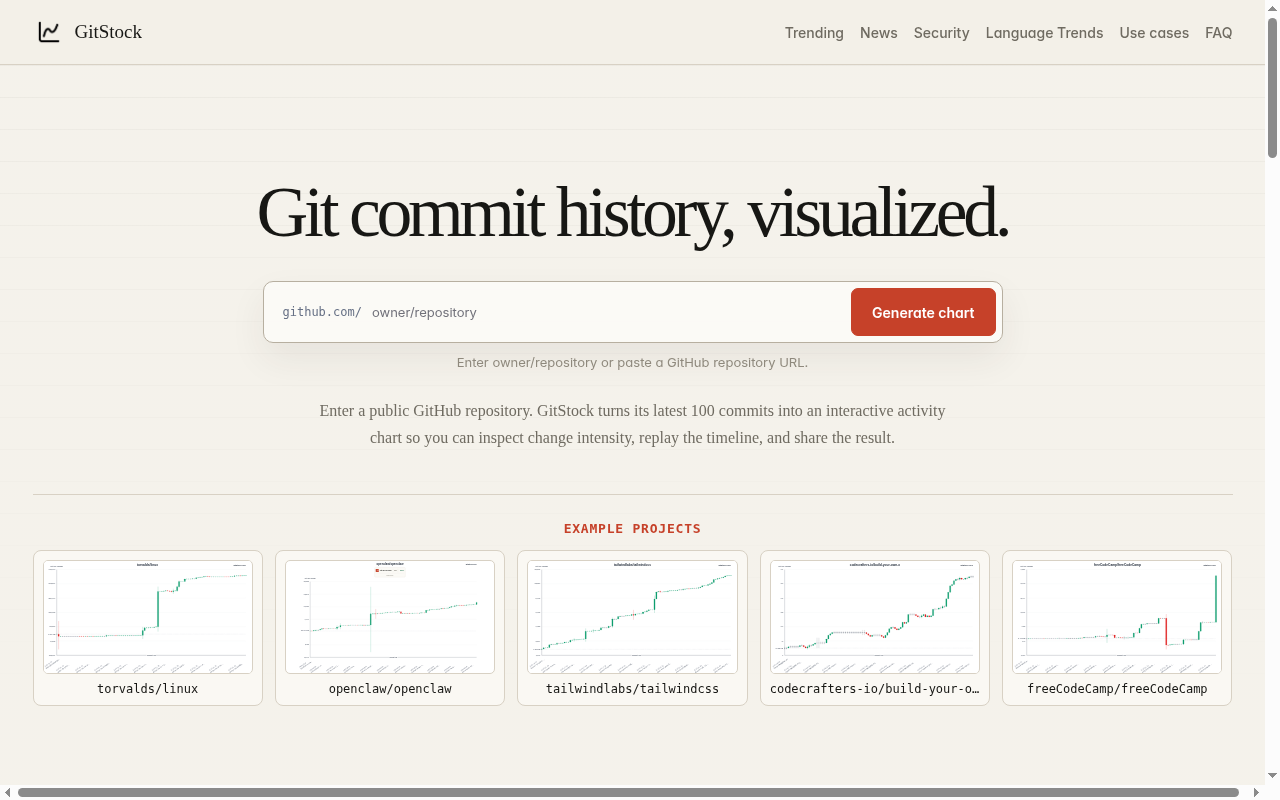
Above: the GitStock homepage — enter a public owner/repo to chart recent commit activity.
There is no GitHub login and no paid plan on the site. Private repositories are out of scope; if the repo is not public, the tool will not see it. The "latest 100 commits" limit is real — do not expect a full-history rewrite of a ten-year project.
Beyond a single repo: trending and feeds
GitStock is not only a per-repo chart. The same site keeps a daily, weekly and monthly GitHub Trending archive, a free read-only GitHub Trending JSON API that needs no API key, a view of GitHub projects discussed on Hacker News, language popularity trends, and a security advisories feed. For README authors, the combination of a commit activity chart plus a trending archive is more useful than either alone.
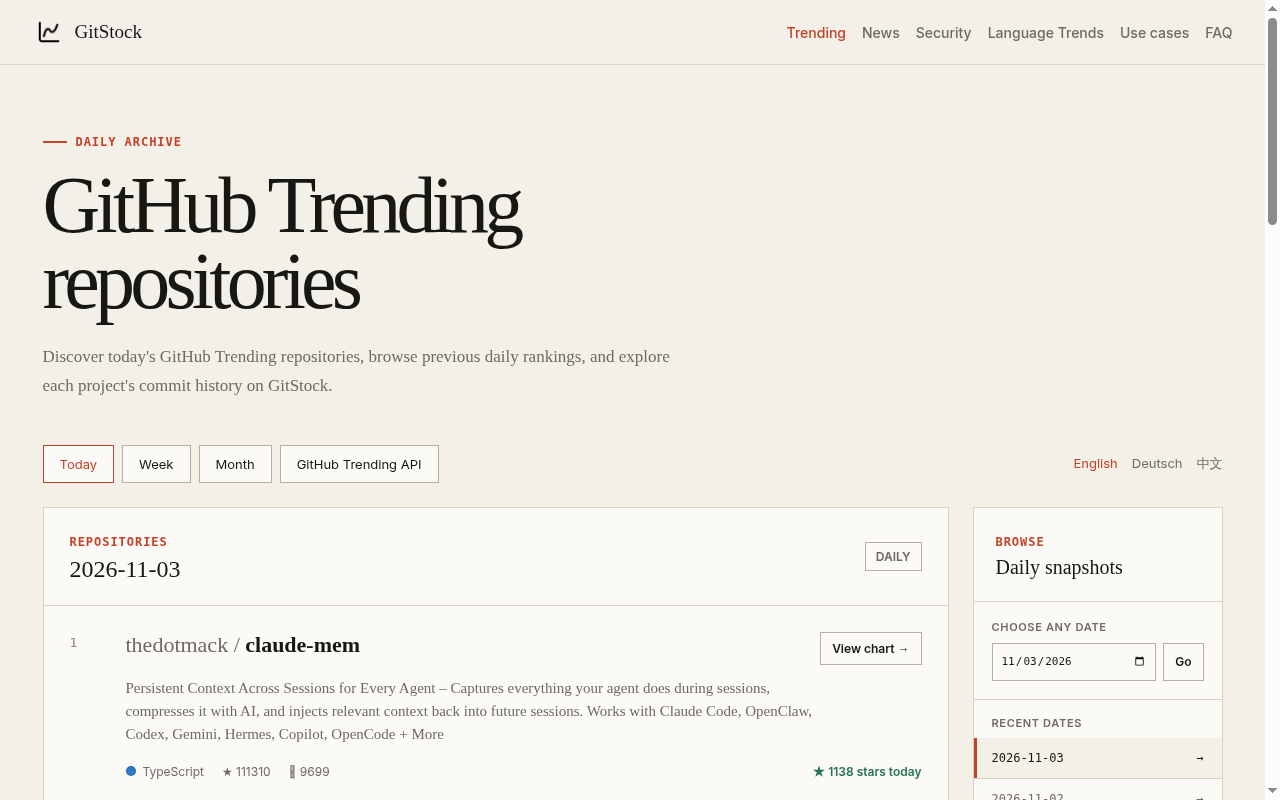
Above: GitStock's GitHub Trending archive — useful when you want history, not only the live list.
How I embed a chart in a README
My usual steps:
- Open gitstock.org and paste the public repo.
- Confirm the candle chart matches what I expect for the default branch.
- Export the Markdown or HTML embed (or an SVG URL) and paste it under a short heading such as "Recent commit activity".
- Mention that the chart reflects the latest 100 commits so readers are not misled.
That is enough for most open-source landing pages. If you need private-repo analytics, you still want GitHub's own insights or an authenticated app — GitStock does not pretend to replace those.
Related notes
If you also publish screenshots or generated assets alongside README charts, these adjacent notes may help:
- Face analysis and the attractiveness test: what the score actually measures
- Attractiveness test online: what AI face analysis actually measures
Opaque scores and activity metrics both need plain-language caveats; the linked pieces are about reading a number without overselling it.